June 11, 2013
Making use of how plants tell time
Plants give us silent hints of the optimal time to apply insect and disease controls.
The key is to observe and use them.
BY MELISSA SPEARING, NPD ’13Heat waves in July are soon forgotten, but the heat wave of March 2012 won’t be. Living and working at the Niagara Parks Botanical Gardens made the early flush of warmth even more obvious, as buds and blossoms of so many species erupted en masse. On March 26, I rushed to capture photos before the threat of heavy frost. Days later, magnolias in full flower looked like they were decorated with brown paper bags. Despite a few success stories, fruit orchards and nurseries experienced significant cold temperature injury to crops that had budded out early. Our magnolias recovered a few weeks later and lateral flower buds soon opened to disguise the frosted terminals. The end. Or is it?
At the Landscape Ontario Growers Short Course this past February, I surveyed attendees about the effects unusual weather patterns have had on their businesses. Besides frost damage, responses included digging, transplanting, shortened shipping windows, lack of snow cover, undesirable nutrient release, drought effects, wind damage, as well as pest management and seed collection challenges. Many alluded to issues of scheduling seasonal employees, irrigation and meeting production timelines. These are just effects on growers! If you are in retail, snow removal, turf care, arboriculture, landscape design, maintenance, research or agri-tourism, how have your normal routines been interrupted? Can anything be done to minimize these risks?
It is impossible to erase all stresses in business, but I envision new management tools are possible with data on these freakish weather patterns, plant responses and what successful actions have been taken so far.
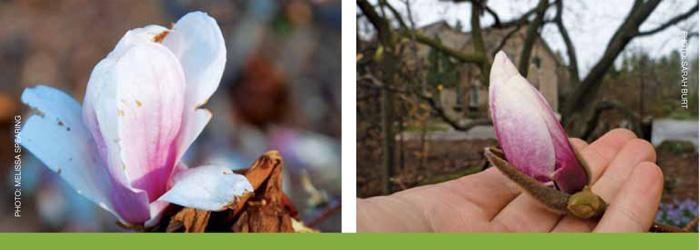
Comparing the stage of development of Magnolia xsoulangiana blossoms from the heat and frosts of spring 2012 to a phenologically normal spring in 2013. At left, Magnolia xsoulangiana on April 17, 2012, compared with the same species on April 19, 2013.
You may not recognize the word “phenology,” but you practice it every day. Phenology is the study of recurring biological events and the relationship to environmental factors; essentially, it is how organisms tell the time of year. Temperature is the primary driver of plant and insect development, but research shows photoperiod, water availability, topography and elevation, nutrients, CO2 levels, fire, genetics, and even natural co-evolution of plants and their pollinators can influence when and how long growth stages occur. Horticulture is all about manipulating plant growth to suit our needs, but surprisingly, we don’t have hard facts for many ornamental crops.
Phenologists can isolate main factors if they have multiple years of observations from the same location: local weather data, the date, a properly identified species or cultivar and the life cycle stage called a “phenophase.” Bud burst, full bloom or adult insects emerging are easily observable stages that we know are initiated or halted by the weather.
 As horticulturists, we also have “phenophases” such as when to dig, prune, pro-pagate, fertilize, water, spray and mow. If done correctly, our actions march in step with plant development. Do you know what order of species to dig bare root in accordance with spring soil temperatures? Do you know at what development stage you should do the first cut of cool-season Festuca lawns to discourage flowering? Do you use evapotranspiration sensors to verify irrigation needs? Most of us go on experience or a gut feeling with these kinds of questions, but accurate records from past years mean we can better forecast when to take action as weather unfolds. From there, statistical models give us hard numbers to work with.
The most common model used to quantify and predict accumulated heat units before a phenophase will occur is called growing degree-days (GDD). In order to make sense of GDD recommendations, you must know the formula parameters used (i.e., the starting date or biofix, base 10°C, sine wave method). For a good reference, see Daniel Herms’s article at http://www.entomology.umn.edu/cues/Web/049DegreeDays.pdf. Despite some limitations, GDD is still more accurate than scheduling a pesticide application every May 1.
Phenology pervades so many aspects ofwhat we do. Regional calendars of bloom for landscape design, selection of new cultivars, specific pruning schedules for woody plants, planning native species seed collection and experimenting with new propagation techniques are just a few examples. But I wanted to know how phenology can be useful to you; the majority of respondents to my survey in February identified pest management and production or work scheduling as priorities.
Phenology and IPM
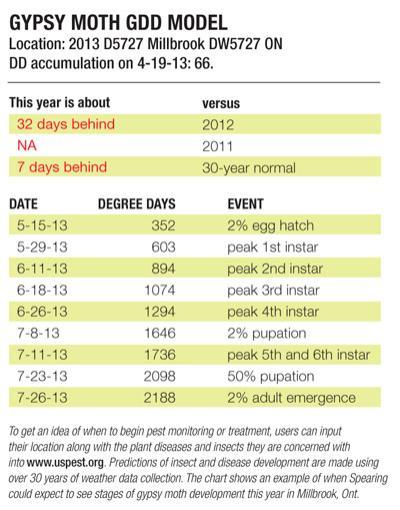
The influence of weather on pest life cycles is well documented, as is timing for effective scouting, cultural control and application of pesticides or use of biological insects. Important phenology information is already embedded within standard IPM references, from our own OMAFRA publications to too many resources online to list here. If I must highlight one, http://uspest.org/wea/ spans all of Canada and the U.S., covering agricultural and horticultural crops and pests. For my area, the Gypsy Moth GDD model shown on this page (starting Jan. 1, 42°F base temperature), tells me I should expect the peak of first instar larvae at 603 GDD, or around May 29. Specific information leads to specific action.
A Living Weather Station
Donald Orton, a retired USDA nursery inspector from Illinois, developed a synchronous plant indicator program aptly named Coincide (2007, available from www.laborofloveconservatory.com). The Orton System uses obvious phenophases of 54 landscape plants as indicators for monitoring and controlling 102 widespread pests and diseases. He doesn’t make specific pesticide recommendations, only noting vulnerable phenophases of the pest’s life cycle.
Another practical suggestion Orton made was to plant a phenology garden and use it as a living weather station. You could plant all 54 species if desired, but I narrowed it down to the top 12 plants (and one weed if you can tolerate it) that cover a wide range of pest species and have observable phenophases from the earliest onset of spring to the end of our normal growing season.
Here they are in phenological order (starting Jan 1, base 10°C for GDD ranges):
- Acer saccharinum (0-1780 GDD, 36 pest correlations)
- Syringa vulgaris (0-280 GDD, 32 pests)
- Magnolia xsoulangiana (25-115 GDD, 46 pests)
- Amelanchier laevis or A. xgrandiflora (25-500 GDD, 52 pests)
- Spiraea xvanhouttei (100-335 GDD, 43 pests)
- Aesculus hippocastanum (110-335 GDD, 33 pests)
- Sorbus aucuparia (150-1225 GDD, 34 pests)
- Viburnum dentatum (220-1615 GDD, 23 pests)
- Hydrangea arborescens ‘Grandiflora’ (275-1170 GDD, 52 pests)
- Cirsium arvense (385-945 GDD, 45 pests)
- Sambucus canadensis (500-670 GDD, 11 pests)
- Solidago canadensis (1000-1725 GDD, 24 pests)
- Hamamelis virginiana (1000-1780 GDD, 6 pests)
How to Make the Tools We Need
Although production scheduling was the second priority of survey respondents, I found limited practical options that meet the challenges of business and wacky weather and are tailored to growers. The next generation of horticulturists isn’t afraid to get their hands dirty, but they expect decisions to be guided by user-friendly mobile information, remote sensors and collaborative social networking. We also need to “download” the collective wisdom of our elders and work with our peers to identify which industry-wide problems to tackle first. We need to bring together multi-disciplinary teams. I nominate Matt Deir.
Deir is the chief software architect for Dragonfly Information Technology a Kingston, Ont.-based company specializing in custom desktop, online and mobile agribusiness tools. Dragonfly’s Fruit Tracker application is exactly what I envisioned as a multi-functional solution. With initial support from the Ontario Apple Growers, Dragonfly took the OMAFRA Fruit Production Recommendations, Publication 360, and converted it into a searchable database of pest cycles and spray recommendations, with associated plant phenophases (hooray!). Users select the type and calibration of spray equipment, and click on a GPS-mapped inventory block to calculate the tank mix needed. A workorder and MSDS sheets are printed off for the applicator. The spray record notes real-time weather conditions at time of application, in case of conflicts with pesticide recommendations. It has modules for scouting reports, and can send weather-based email or text alerts. The user’s data can generate GAP audit reports and shipping labels. Currently, paid members of the Ontario Tender Fruit Producers Association benefit from easy access to cost-shared licensing and development of Fruit Tracker.
Deir explained to me that converting our own Publication 383, or any other supplied data including a grower’s own notes, would be easy using Fruit Tracker’s system. I explained similarities and differences in managing our businesses compared to an orchard. He was intrigued and unfazed by production scheduling challenges, our phytosanitary programs, integrating with remote sensors, irrigation and greenhouse systems, inventory mapping and barcoding, and the idea of an anonymous feedback loop for industry research such as new crop phenology models. So exciting to contemplate!
We are brainstorming ways of collecting landscape and nursery observations but, currently, you can contribute basic phenology data for native and cultivated species to the Canada PlantWatch program, or two U.S. networks that accept Canadian locations: the USA National Phenology Network and Project BudBurst from Cornell University.
We can build any phenology-based tool we can conceive, but your support will be the sunshine we need to grow. Please contact me if you have comments, questions or data you’d be willing to share. Most of all, keep notes! They are more valuable than you think.
Melissa Spearing is a second-generation grower at Ground Covers Unlimited of Bethany, Ont. She recently graduated from the Niagara Parks Commission School of Horticulture with hopes of turning horticultural science into practical business ideas, and vice versa. She doesn’t have an iPhone yet, but can still be reached at groundcoversunlimited@gmail.com